| ppefmh | Ed | Garstin | 1/2 | The graph below shows 2 different power supplies A and B. | 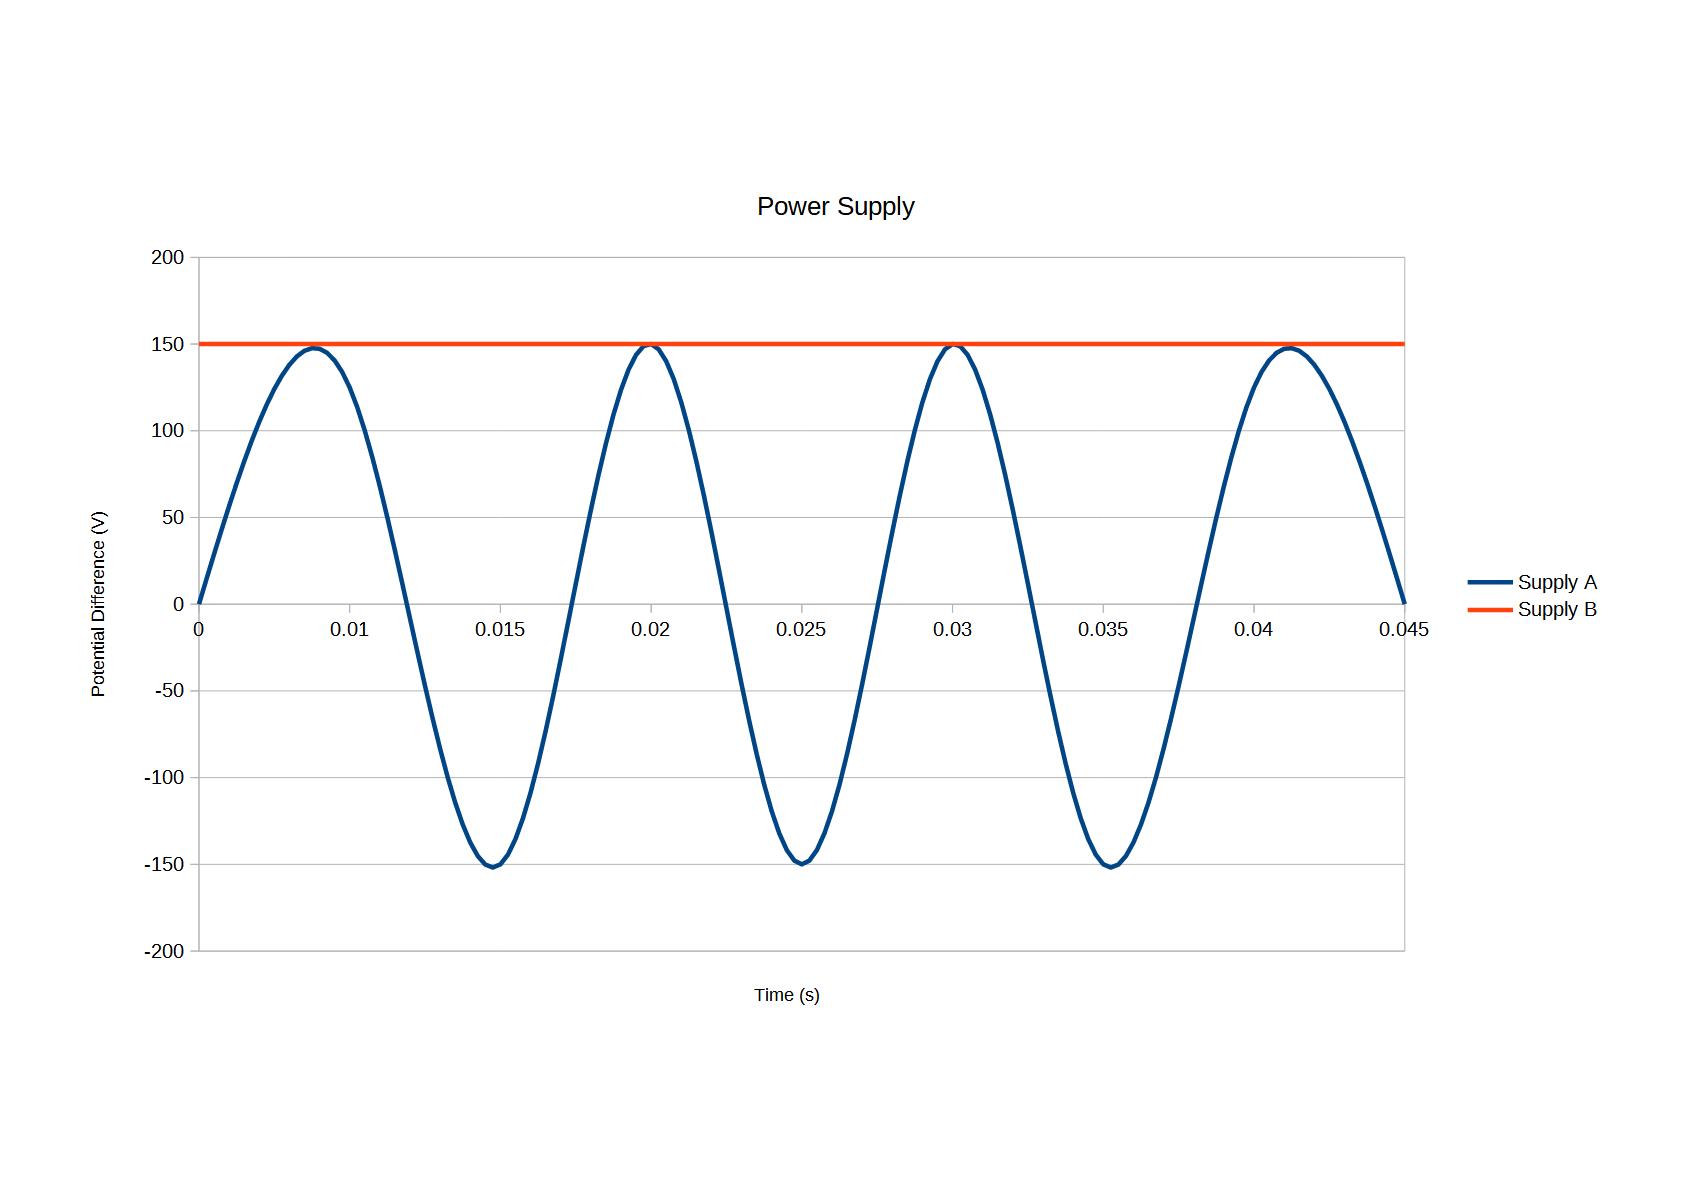 |
-
The graph shows that supply A has a potential difference that is constant at around 150v. Because the potential difference is not changing we know this is a direct current (DC).
-
The graph shows that supply B has a potential difference that is constant at around 150v. Because the potential difference is not changing we know this is a direct current (DC).
-
The graph shows that supply A has a potential difference that is constant at around 150v. Because the potential difference is changing we know this is a direct current (DC).

|
-
Frequency = 100 Hz (1 / 0.01 time fore one complete cycle)

-
Frequency = 1000 Hz (1 / 0.001 time fore one complete cycle)
-
Frequency = 10 Hz (1 / 0.1 time fore one complete cycle)
-
Frequency = 1 Hz (1 / 1 time fore one complete cycle)
| 50% |
| ppefmh | Ed | Garstin | 1/2 | The graph below shows 2 different power supplies A and B. | |
-
The graph shows that supply A has a potential difference that is constant at around 150v. Because the potential difference is not changing we know this is a direct current (DC).
-
The graph shows that supply B has a potential difference that is constant at around 150v. Because the potential difference is not changing we know this is a direct current (DC).
-
The graph shows that supply A has a potential difference that is constant at around 150v. Because the potential difference is changing we know this is a direct current (DC).
|
-
Frequency = 100 Hz (1 / 0.01 time fore one complete cycle)
-
Frequency = 1000 Hz (1 / 0.001 time fore one complete cycle)
-
Frequency = 10 Hz (1 / 0.1 time fore one complete cycle)
-
Frequency = 1 Hz (1 / 1 time fore one complete cycle)
| 50% |
