
Distance-Time Graphs 2
| First | First | Last | Results | Question 2 | Image 2 | 2a) Select the correct description of the runners journey below? | Calculate the speed during Part A? | Correct Answer | Round Answer | Results | Show your workings: | Calculate the speed during Part B? | Correct Answer C | Round Answer C | Results C | Show your workings: | 2c) How does part C show that the runner stopped? | Quiz Score Total | Quiz Percentage Grade |
|---|---|---|---|---|---|---|---|---|---|---|---|---|---|---|---|---|---|---|---|
| ppefmh | Ed | Garstin | Incorrect | A runner was training on a straight track. The distance-time graph is shown below. | 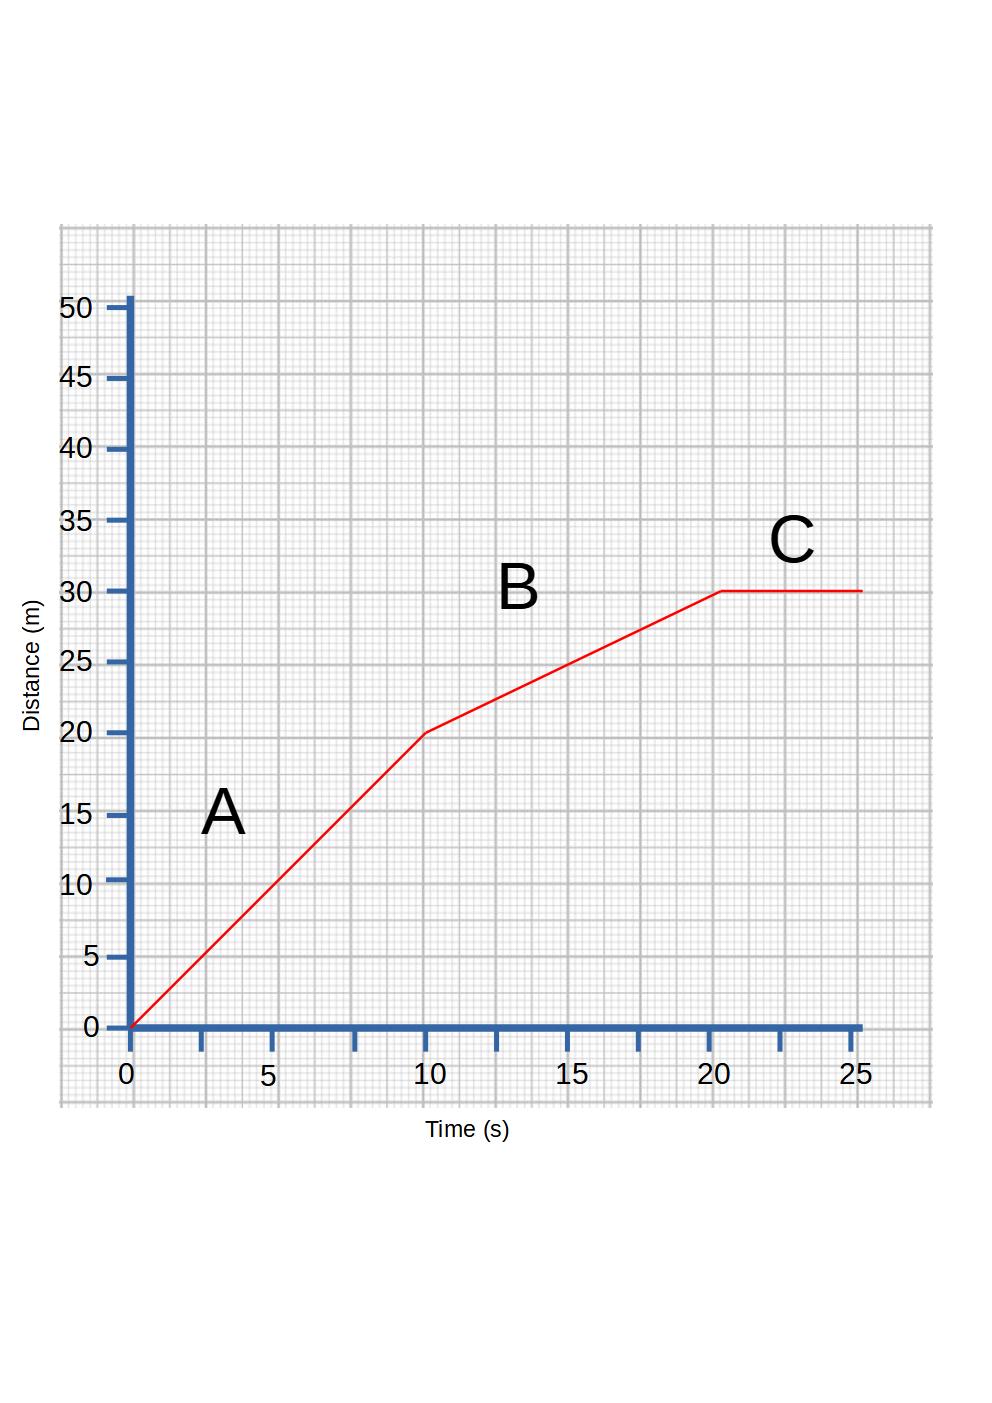 |
| 543 | 2 | 2 | Incorrect | gdgfd | 534 | 1 | 1 | Incorrect | fg |
| 1/2 | 50% |
| First | First | Last | Results | Question 2 | Image 2 | 2a) Select the correct description of the runners journey below? | Calculate the speed during Part A? | Correct Answer | Round Answer | Results | Show your workings: | Calculate the speed during Part B? | Correct Answer C | Round Answer C | Results C | Show your workings: | 2c) How does part C show that the runner stopped? | Quiz Score Total | Quiz Percentage Grade |