
Distance-Time Graphs 3
| First | First | Last | Results | Question 3 | Image 3 | 3a) Select the correct description of the runners journey below? | Image 3 | 3bi) Calculate the speed during Part A? | Correct Answer | Round Answer | Results | Show your workings: | 3bii) Calculate the speed during Part B? | Correct Answer B | Round Answer B | Show your workings: | 3biii) Calculate the speed during Part C? | Correct Answer C | Round Answer C | Results C | Show your workings: | Quiz Score Total | Quiz Percentage Grade |
|---|---|---|---|---|---|---|---|---|---|---|---|---|---|---|---|---|---|---|---|---|---|---|---|
| ppefmh | Ed | Garstin | Incorrect | A person is cycling down a straight road. The distance-time graph is shown below. | 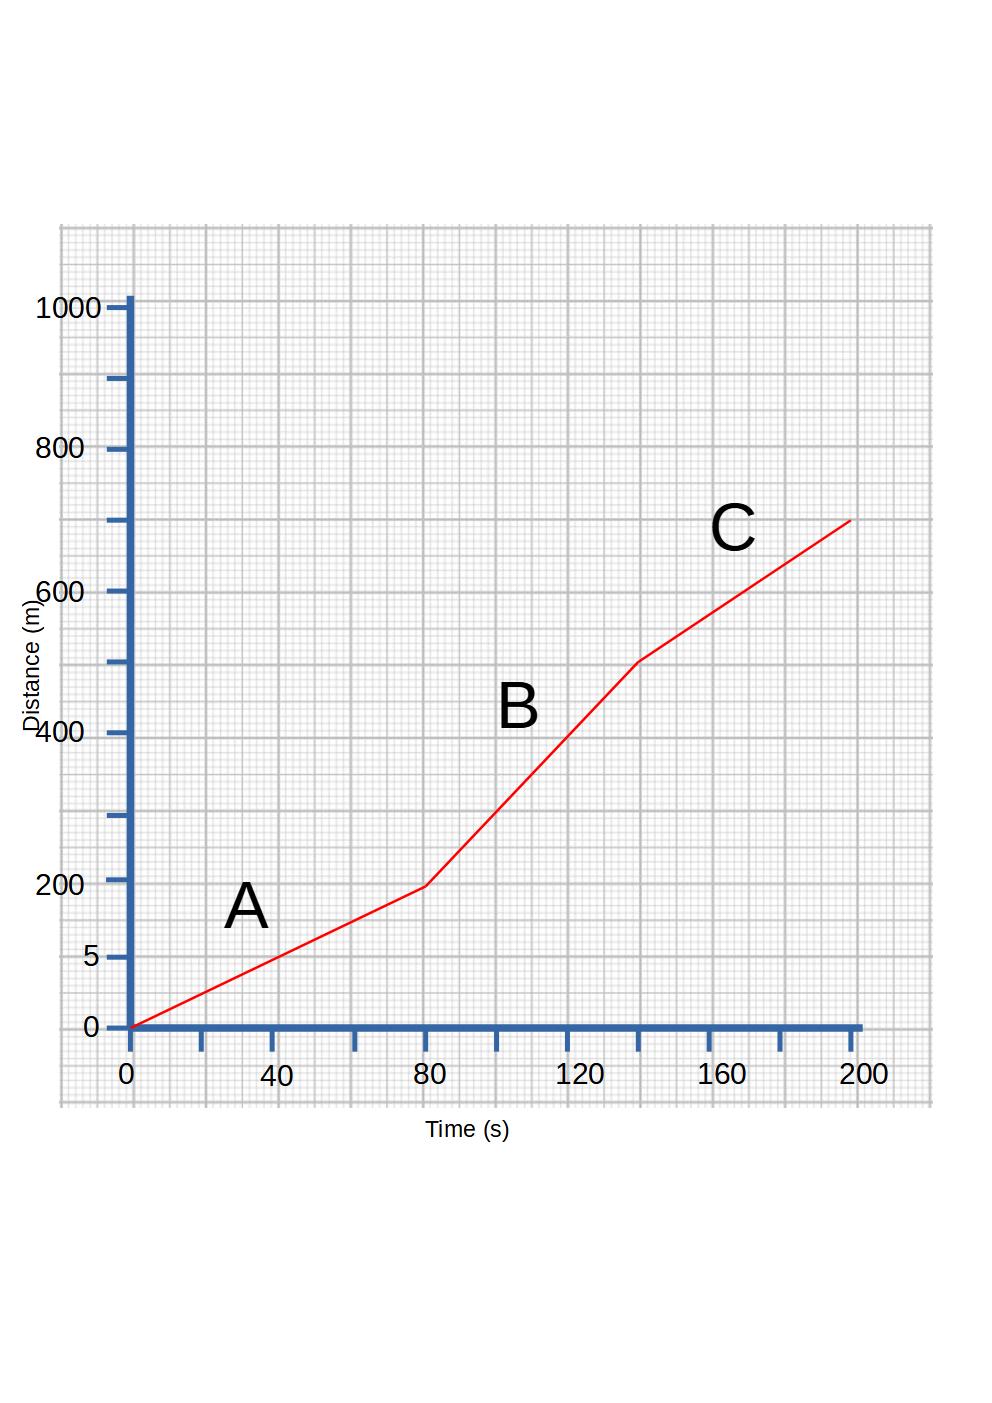 |
| | 543 | 2.5 | 2.5 | Incorrect | gfd | 453 | 5 | 5 | gd | 5443 | 3.3333333333333335 | 3.33 | Incorrect | fgdg | 0/1 | 0% |
| First | First | Last | Results | Question 3 | Image 3 | 3a) Select the correct description of the runners journey below? | Image 3 | 3bi) Calculate the speed during Part A? | Correct Answer | Round Answer | Results | Show your workings: | 3bii) Calculate the speed during Part B? | Correct Answer B | Round Answer B | Show your workings: | 3biii) Calculate the speed during Part C? | Correct Answer C | Round Answer C | Results C | Show your workings: | Quiz Score Total | Quiz Percentage Grade |