
Distance-Time Graphs 4
| First | First | Last | Results | Question 4 | Image 4a1 | Image 4a2 | 4a) How can we tell from the graphs above that bot the cars are accelerating? | Image 4a1f | Calculate the speed of the car at 8 seconds in the graph above | Correct Answer | Round Answer | Results | Show your workings: | Image 4a2f | Calculate the speed of the car at 8 seconds in the graph above? | Correct Answer C | Round Answer C | Results C | Show your workings: | Quiz Score Total |
|---|---|---|---|---|---|---|---|---|---|---|---|---|---|---|---|---|---|---|---|---|
| ppefmh | Ed | Garstin | Incorrect | The distance-time graphs below show two cars driving down a straight road. | 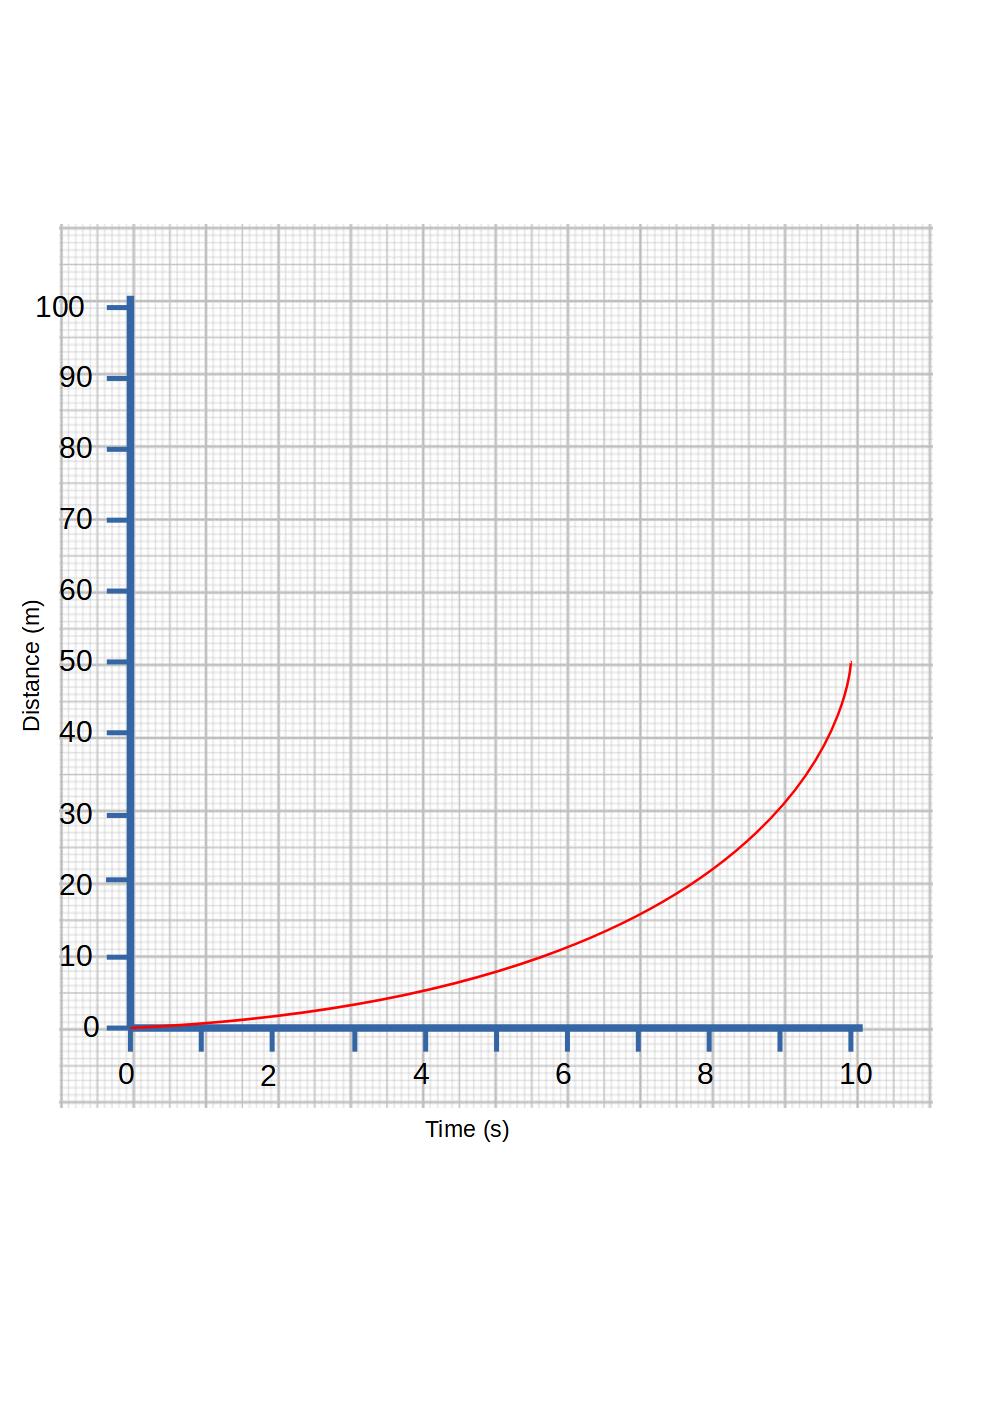 | 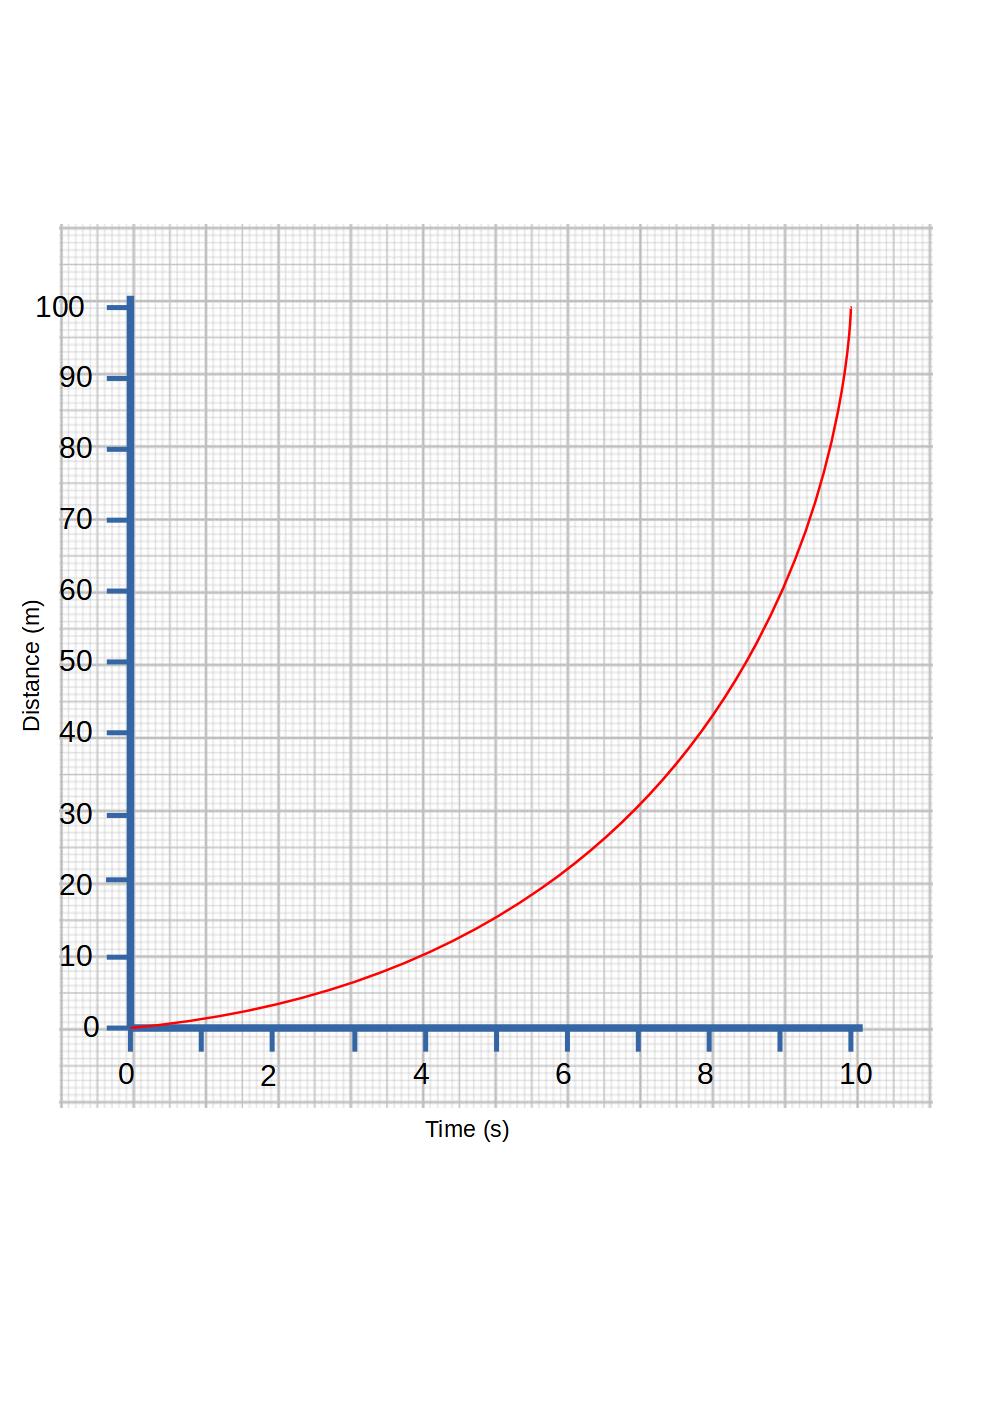 |
|  | 543 | 6.25 | 6.25 | Incorrect | gfdg | 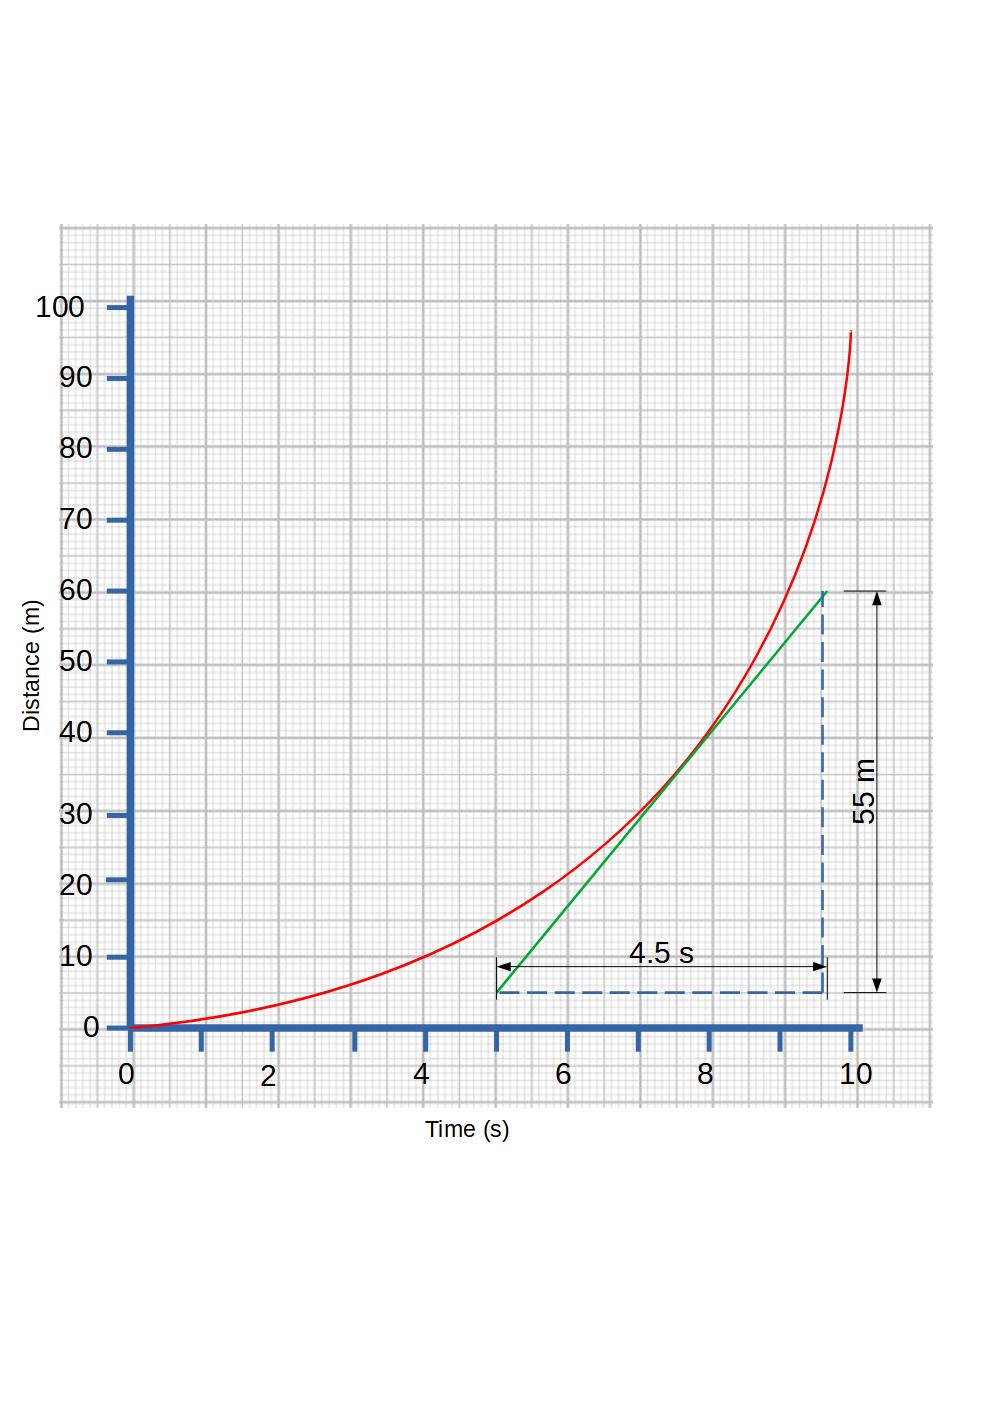 | 54 | 12.222222222222221 | 12.22 | Incorrect | gd | 0/1 |
| First | First | Last | Results | Question 4 | Image 4a1 | Image 4a2 | 4a) How can we tell from the graphs above that bot the cars are accelerating? | Image 4a1f | Calculate the speed of the car at 8 seconds in the graph above | Correct Answer | Round Answer | Results | Show your workings: | Image 4a2f | Calculate the speed of the car at 8 seconds in the graph above? | Correct Answer C | Round Answer C | Results C | Show your workings: | Quiz Score Total |